The PHEV emissions gap your fleet report may be missing
10 min read · 23 October 2026. The same car, two operating profiles. What one plug-in hybrid's own data shows about the figures that go into ESG and SECR reports.
Plug-in hybrids are often treated as low-emission vehicles because they can drive on electric power. But the environmental benefit depends on what happens after the vehicle is handed to the driver.
Is it charged regularly? Does it begin journeys with energy in the battery? Does the claimed efficiency appear in real-world fuel data?
Connected-vehicle data from one PHEV shows why those questions matter. Before the operator's charging behaviour changed, the vehicle was used largely like a conventional petrol car. Afterwards, it was charged far more often and used materially less petrol per mile.
This is not a comparison between two vehicles or two laboratory ratings. It is the same vehicle, measured with the same methods before and after the change.
The headline result
Between 23 March and 24 May 2026, Vehicle A had 13 charge days against 53 driving days: 0.25 charge days per driving day.
In the later study window, from 21 July to 18 October, it had 76 charge days against 86 driving days: 0.88 per driving day. Charging became about three and a half times as frequent, and at least three times on the strictest count, set out in the methodology.
Fuel economy improved over the same period.
| Vehicle A | Before | Transition | Study window |
|---|---|---|---|
| Dates, 2026 | 23 Mar to 24 May | 25 May to 20 Jul | 21 Jul to 18 Oct |
| Miles | 4,929 | 3,950 | 7,392 |
| Petrol used | 450 litres | 322 litres | 510 litres |
| Charge days per driving day | 0.25 | 0.61 | 0.88 |
| Journeys started empty | 81% | 52% | 38% |
| Fuel economy | 50 mpg | 56 mpg | 66 mpg |
Every window uses the same fuel calculation. Fuel was measured three ways, and the three agreed within about 7% in each window. A journey started empty when the battery read 1% or less.
What the fuel data shows
The study window covered about 50% more miles than the earlier period, but petrol use rose by only about 13%, from 450 litres to 510.
Adjusted for mileage, the difference is clearer:
- Before: about 9.1 litres per 100 miles.
- Study window: about 6.9 litres per 100 miles.
- Reduction: about 24% less petrol per mile.
With the same petrol emissions factor applied to both periods, petrol-derived CO₂e per mile also fell by about 24%.
Keep the two measures apart. Charging became about three and a half times as frequent; petrol-related emissions per mile fell by about a quarter. The data does not show total CO₂e falling in step with the charging.
A second check: the battery at journey start
Charging frequency is not the only indicator.
Before the change, 81% of journeys started with an empty battery. In the study window, 38% did.
That is a second check, from a different measurement, on whether the vehicle was actually setting off with stored electrical energy. A charging record alone can mislead, because a car can be recorded as charging and still set off with little energy in the battery.
The monthly data shows the same pattern. Charging was limited in March, April and May, and fuel economy stayed at 49 to 50 mpg. Charging rose through June and held at about 0.9 charge days per driving day from July to September, when fuel economy reached 67 to 72 mpg.
The relationship is not perfectly linear. October's 60 mpg came as autumn set in, with a little less charging and the longest days of the period, at 108 miles per driving day. That is why the comparison uses defined windows rather than a single flattering month.
What changed month by month
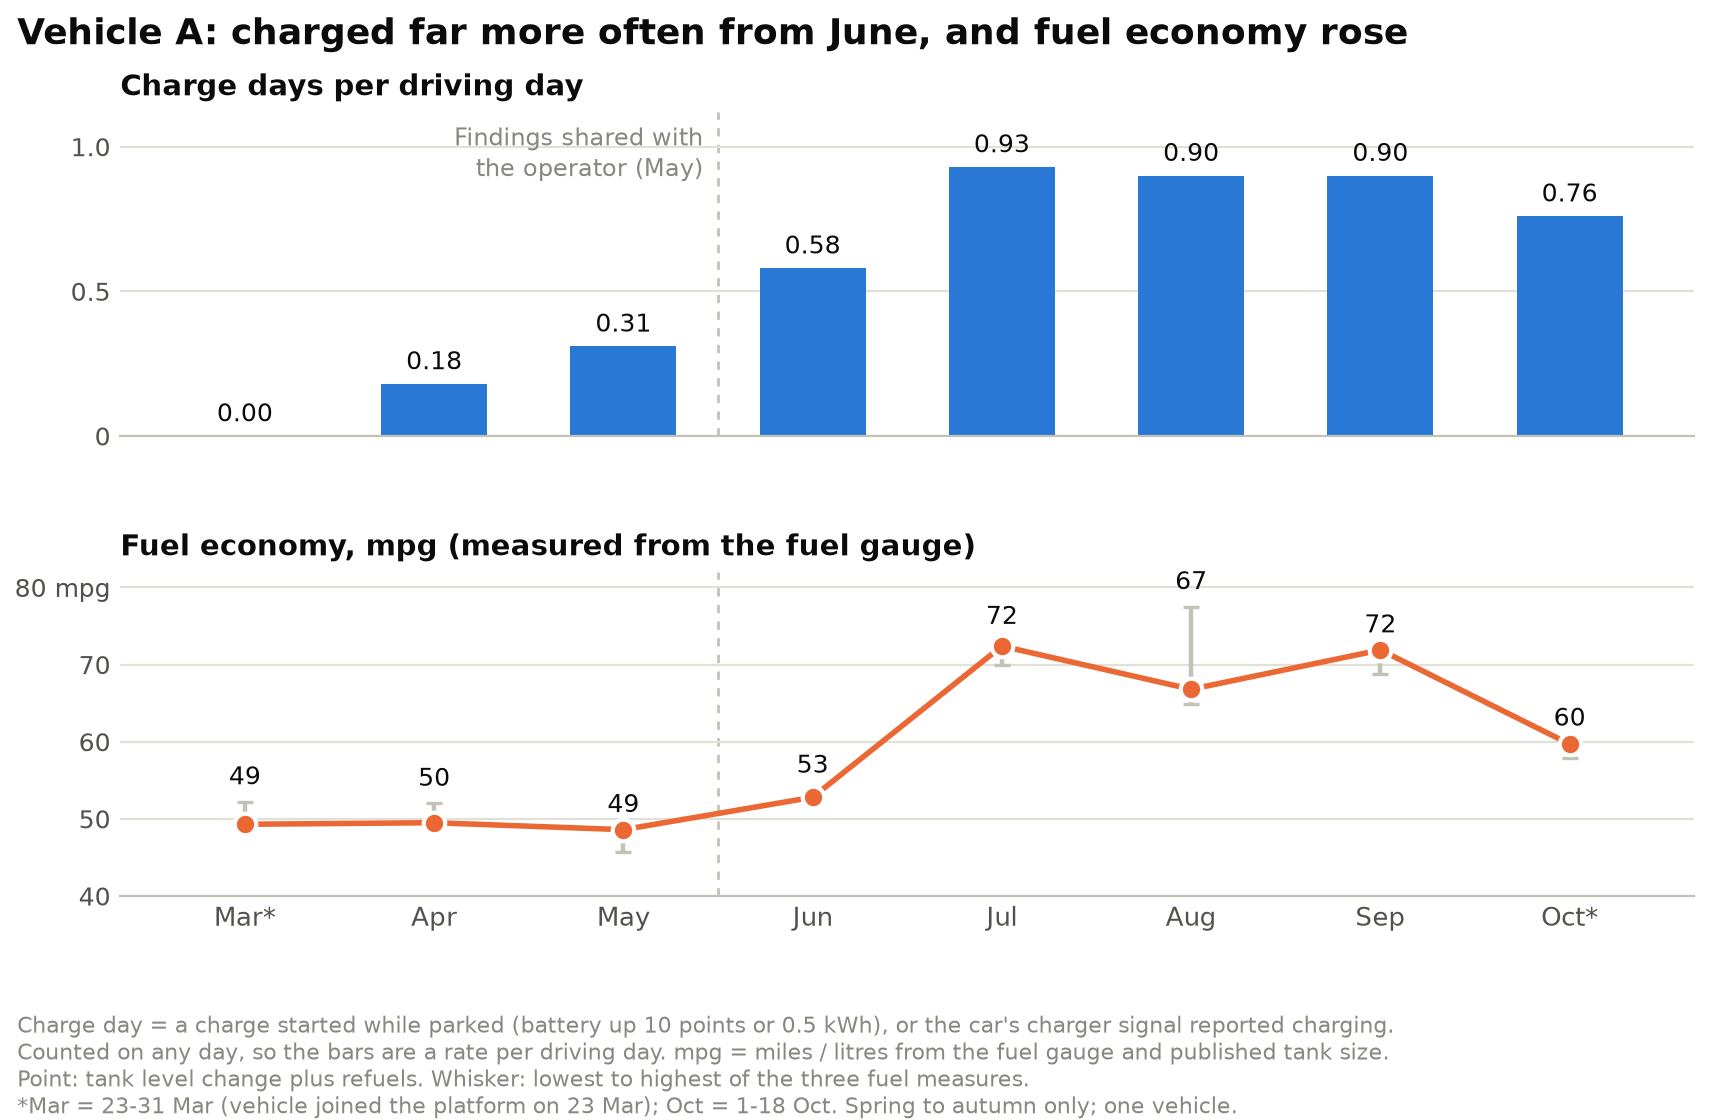
| Month, 2026 | Charge days per driving day | Journeys started empty | Fuel economy |
|---|---|---|---|
| March (23 to 31) | 0.00 | 98% | 49 mpg |
| April | 0.18 | 86% | 50 mpg |
| May | 0.31 | 74% | 49 mpg |
| June | 0.58 | 61% | 53 mpg |
| July | 0.93 | 30% | 72 mpg |
| August | 0.90 | 22% | 67 mpg |
| September | 0.90 | 44% | 72 mpg |
| October (1 to 18) | 0.76 | 44% | 60 mpg |
August's is the least certain monthly figure. Its three fuel measures differ by 19%, against about 7% or less in every other month; the within-journey measure, which leaves out journeys with too few fuel-gauge readings, reads lowest.
Two other explanations are worth testing against the months. Season first: the before period is spring, and the study window runs from summer into autumn. But fuel economy held at 49 to 50 mpg from late March to the end of May, through the spring, while charging stayed low. Then day length, because longer days leave more miles beyond the battery. April and September both averaged 86 to 87 miles per driving day, the same as the study window. April, at 0.18 charge days per driving day, returned 50 mpg; September, at 0.90, returned 72.
The pattern is consistent with a change in how the vehicle was operated, not a change in its specification. Even so, the data supports saying that fuel economy improved after the charging changed, not that the charging caused it. It is observational and covers one vehicle.
Why this matters for ESG reporting
A PHEV is not an emissions category by itself. It is a vehicle whose emissions depend heavily on how it is operated.
A fleet report that assumes every PHEV is regularly charged can understate real-world emissions when vehicles are rarely plugged in. Before the change, 81% of this vehicle's journeys started with an empty battery. Treating it as though it routinely set off with stored electrical energy would have produced an emissions profile the data did not support.
The gap against the official figure is wider still. Vehicle A's official CO₂ figure is 21 g/km. Measured from the fuel gauge, its petrol alone came to about 118 g CO₂e/km before the change and about 89 g/km in the study window. Electricity is excluded from both, as it is from the official figure.
The opposite error is also possible. If a report carries forward an inefficient early baseline after charging behaviour improves, it may overstate the vehicle's fuel-related emissions.
The fleet therefore needs evidence of operating behaviour, not just a list of vehicle types. Useful evidence includes:
- Actual petrol consumption.
- Actual mileage.
- Charging frequency.
- Battery level at the start of journeys.
- Electricity used for charging.
- The emissions factors applied.
- The reporting period and boundary.
The UK government's conversion factors for company reporting support calculations from activity data such as fuel used, electricity consumed and distance travelled.
The SECR connection
For organisations within the scope of Streamlined Energy and Carbon Reporting, the reporting process should follow a documented methodology and use appropriate activity data.
Fuel used by owned or controlled vehicles will generally be relevant to direct emissions reporting. Business travel in employee-owned or hired vehicles may be treated differently, depending on whether the organisation buys or reimburses the fuel and on the reporting boundary it applies.
For a PHEV, the central reporting question is simple: does the emissions calculation reflect how the vehicle was actually operated?
Vehicle A's data gives a practical way to test that question. The same vehicle had two materially different operating profiles:
- A largely uncharged profile, with 81% of journeys starting empty and about 50 mpg.
- A regularly charged profile, with 38% of journeys starting empty and about 66 mpg.
An average factor cannot tell the two apart. The government's 2026 factor for an average plug-in hybrid car is 89.6 g CO₂e per km for the fuel, with the electricity counted separately. That is close to Vehicle A's charged profile and about a quarter below its uncharged one. A distance-based calculation using the average would have looked right for the study window and understated the months before it.
The fuel data does not replace a full CO₂e calculation. Electricity used for charging, and the factor for it, should be included where available. But the fuel data does show whether the petrol side of the model is credible.
What the data shows, and what it does not
The evidence supports five clear conclusions:
- Charging rose from 0.25 to 0.88 charge days per driving day: about three and a half times as often, and at least three times on the strictest count.
- Journeys starting with an empty battery fell from 81% to 38%.
- Fuel economy improved from about 50 mpg to about 66 mpg.
- Petrol use per mile fell by about 24%.
- The same vehicle produced materially different fuel-related emissions profiles under different charging behaviour.
The data does not prove that total CO₂e fell in proportion to the rise in charging. That claim would need petrol consumption, the electricity used for charging and the right emissions factor for each energy source, combined.
The stronger and more defensible conclusion is that the vehicle's real-world emissions profile changed substantially with its charging behaviour, and that a PHEV's reported performance cannot be inferred reliably from its badge.
The practical fleet lesson
The issue is not whether PHEVs can be efficient. They can be.
The issue is whether the organisation knows which vehicles are being used efficiently and which are not.
A vehicle specification can tell a fleet manager what a PHEV is capable of. Connected data can show what it is actually doing. That distinction matters for:
- ESG disclosures.
- SECR reporting.
- Fleet decarbonisation plans.
- Benefit-in-kind and policy decisions, including whether a PHEV or a full electric car fits the role.
- Charging infrastructure investment.
- Driver engagement.
- Replacement and leasing strategies.
Without operational data, a PHEV may look low-carbon on paper while behaving like a petrol car on the road.
Five principles: what the brochure says, and what the road showed
We turn vehicle data into fleet decisions through five principles: assess, model, measure, improve and realise. Here is Vehicle A through each one.
Assess
That is the share of driving days one full battery could cover, against 84% of journeys. On the other 55% the car went further, so however often it was charged overnight, those days were always going to use some petrol.
Model
The same car gives two answers, one for each operating profile. Model it as regularly charged when it is plugged in infrequently, and the petrol figure comes out about a quarter too low.
Measure
Petrol alone, before the change, against an official 21 g/km. In the study window it was about 89 g/km. The expectation stayed at 21 throughout; what moved was how the car was used.
Improve
Up from 0.25. The findings were shared with the operator in May; charging rose through June and held at about 0.9 from July to September. That is after, not necessarily because: why it changed is for the operator to say.
Realise
At the earlier rate per mile, the study window's 7,392 miles would have needed about 675 litres. The car used 510. Against that, it put 622 kWh into its battery. The electricity drawn from the meter, which is higher once charging losses are counted, belongs in the full cost and CO₂e figure.
Each step here uses the vehicle's own data. A specification can start the first two; the last three are impossible without it.
Methodology and limitations
The analysis uses data from the vehicle's own connected-car feed, as received by Orbis IO, and is used with the fleet operator's permission. It covers one vehicle and should be read as a case study, not as a representative sample of all PHEVs.
Journeys were identified from odometer movement, with a journey ending when the vehicle was still for more than 20 minutes. Fuel use was estimated three ways from the high-resolution fuel gauge and the published tank size: level change plus refuels, the sum of gauge drops, and fuel burned within journeys. The three agreed within about 7% in each headline window, and the figures quoted use the first.
A charge day is a day on which a charge started while the vehicle was parked between journeys, seen as the battery rising by at least 10 percentage points or 0.5 kWh, or on which the vehicle's own charger-station signal reported charging. A charge day need not be a driving day, so the figures are a rate of charge days per driving day, not a share of driving days.
The battery-energy signal became much denser from 14 June, and the 0.5 kWh rule only works with the denser signal. It makes almost no difference: of its 79 charges in the study window, only one was too small for the 10-point rule to catch. Nor does the denser signal create the step change. On the 10-point and charger-signal rules alone, there were 5 charge days against 10 driving days from 1 to 13 June, and 10 against 16 from 14 to 30 June.
The charger-signal rule also counts days on which charging was reported without a new charge starting. In the study window, the study's rule saw a charge start on 64 of the 76 charge days. Counting only those, the rate is 0.74 per driving day, still three times the before period's 0.25, which counts every kind of charge day. That is the strictest count the data allows.
Our four-vehicle study, How plug-in hybrids are really used (October 2026), counts charges with the 0.5 kWh rule alone, which finds none on this car before June, and defines an empty battery as 10% or less rather than 1%. For the study window, its rules give 64 charge days rather than 76, and 39% of journeys starting empty rather than 38%. The electric-range figures (45% of driving days, 84% of journeys) and the 622 kWh come from that study.
CO₂e uses the DESNZ 2026 petrol factor of 2.075 kg CO₂e per litre. The official figure is the vehicle's type-approval CO₂ figure, from the fleet record.
The analysis covers 23 March to 18 October 2026, spring to autumn. A winter comparison would likely show lower fuel economy and should be analysed separately, not inferred from these figures.
The takeaway
The same PHEV can have two very different emissions profiles.
Before the change, Vehicle A had about one charge day for every four driving days, started 81% of journeys with an empty battery and returned about 50 mpg.
After it, charging was about three and a half times as frequent, only 38% of journeys started empty and fuel economy rose to about 66 mpg.
That is the difference between reporting what a PHEV is designed to achieve and measuring what it actually achieves in service.
If your ESG or SECR reporting assumes that your PHEVs are charged regularly, connected-vehicle data can test that assumption against real-world behaviour.
Find out what your fleet is actually doing.
See the Orbis platform →This article is for general information only and is not reporting, tax or legal advice. The figures describe one vehicle, measured as set out above, and the conversion factors quoted are those published at the date of this article.
Frequently asked questions
Do plug-in hybrids reduce fleet emissions?
Only as far as they are charged. In this case study, the same PHEV used about 24% less petrol per mile once it was charged on most driving days, rising from about 50 mpg to about 66 mpg. Charged infrequently, it ran largely as a petrol car.
How far can a PHEV's real emissions be from its official figure?
A long way. Vehicle A's official CO₂ figure is 21 g/km. Measured from its fuel gauge, the petrol alone came to about 118 g CO₂e/km when it was charged infrequently and about 89 g/km when it was charged on most driving days.
How should PHEV emissions be calculated for SECR?
From activity data where you have it: the fuel the vehicle actually used, the electricity used to charge it and the government conversion factors for the reporting year, within a documented methodology and boundary. A PHEV's badge or official figure does not show how it was operated.
How can a fleet tell whether its PHEVs are being charged?
From the vehicle's own data: how often the battery rises while parked, the battery level at the start of each journey and the fuel used per mile. Here, journeys starting with an empty battery fell from 81% to 38% as charging rose, a second check on the charging record.
Does charging a PHEV more often cut its total CO₂ by the same amount?
No. Charging became about three and a half times as frequent and petrol per mile fell by about 24%. Total CO₂e also needs the electricity used for charging and its emissions factor, so it falls by less than the petrol figure alone suggests.